Culturomics
I have really fallen in love with Google Books Ngram Viewer, so I thought I’d do a little “culturomics” myself. Here’s an image I made using Google’s data:
The brightness of the pixel at position $(x,y)$ is related to how frequently “$x$” appears in books published in the year $y$. Specifically, if $p$ is the number of times “$x$” appears in print during year $y$, divided by the number of times any number less than 2100 appears in print during that year, then $(1 - p)^{1500}$ is the brightness of the pixel at $(x,y)$.
The dark, diagonal edge along the right hand side appears because in year $y$ there are many published appearances of numbers near $y$.
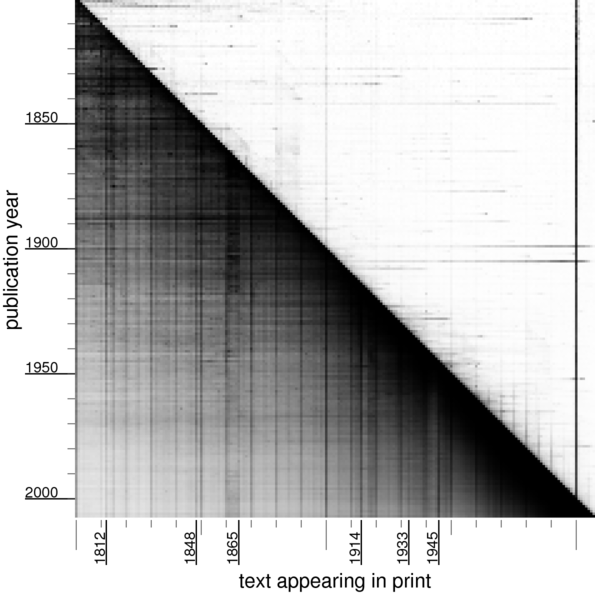
World events have left their mark on the numbers appearing in books! For example, 1914 is still being talked about long after 1914, as evidenced by the darker line above 1914.
If we look at numbers just above 1000 and turn up the contrast a bit,
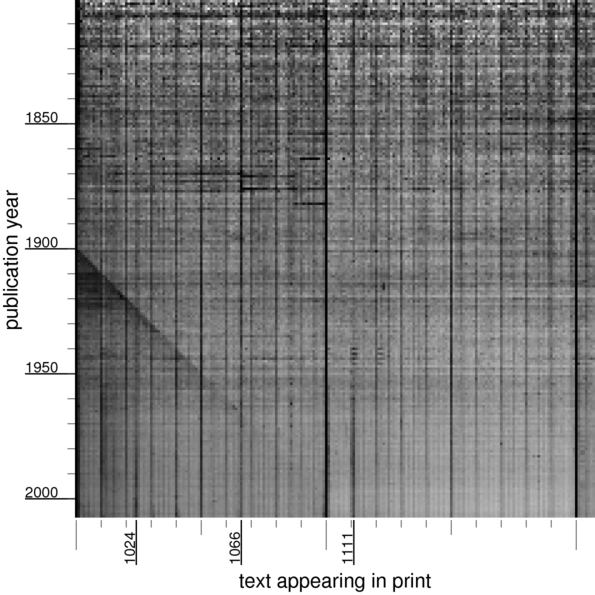
we see an echo of the dark diagonal, from people writing (or more likely, the OCR software reading) zero instead of nine in the year. There’s a dark column for the Norman conquest in 1066; a number like $2^{10} = 1024$ was not so important until the 20th century.
If we look at numbers just above 1300,
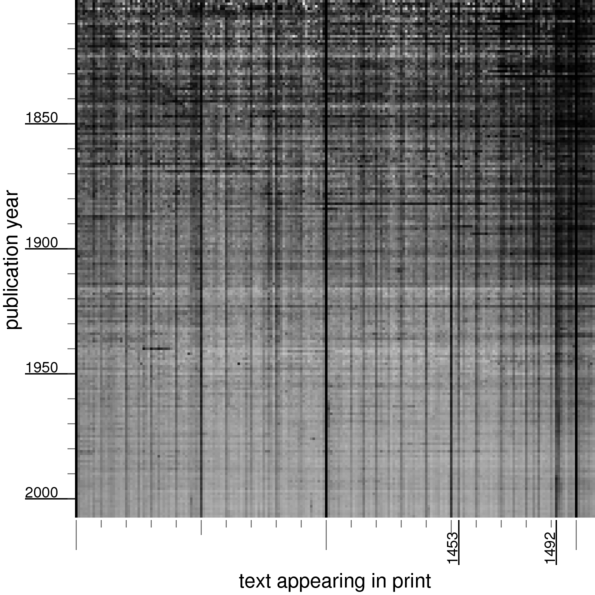
we can see an diagonal line from 1800s being read as 1300s, and a dark vertical line above 1453 (the “end” of the middle ages). In the 18th century,
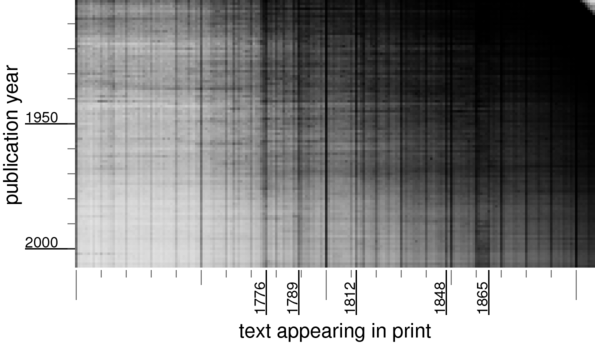
1776 is quite visible. And finally, a puzzle:
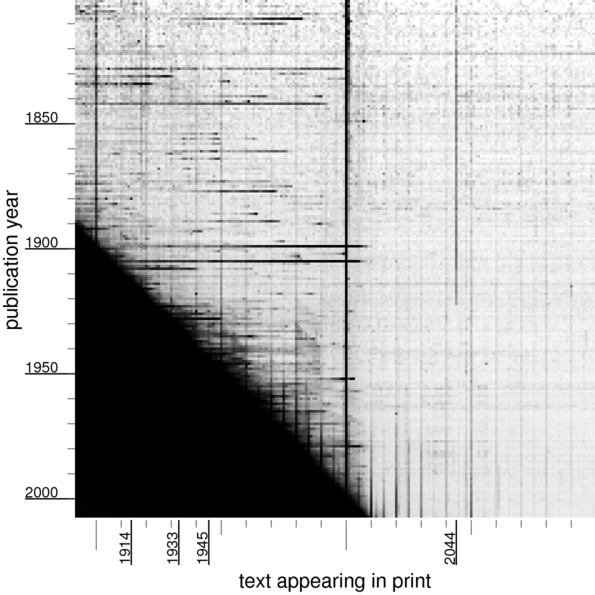
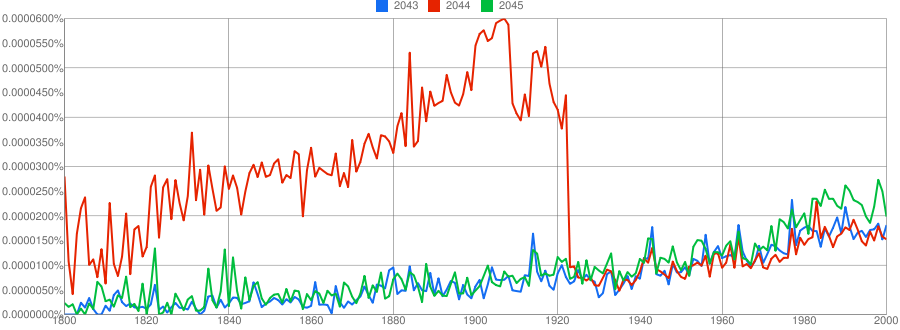
Why was “2044” so significant until the 1920s?
I’d love to know the answer to this question. The only thing I can guess that might relate the year 1919 to the year 2044 is solar eclipses.
Posted: Saturday, December 18, 2010 9:02:45am
Category: Linguistics, History
Permalink and Comments

