A while back I made some movies which began with a triangle in the
plane, reflected that triangle through its three sides, reflected
those triangles through their sides, and so forth. The interesting
result is that for only four shapes of triangles, the resulting set
of triangle vertices is discrete.
Using Raphael and a plane geometry
package that I wrote, I quickly redid this visualization in
Javascript; you can now move the vertices around to see the effect on
the reflected triangles.
My
advisor, Shmuel Weinberger,
was teaching Math 113, and asked for some pictures of the following
procedure:
Start with a triangle in the plane.
Reflect that triangle across its three sides.
And repeat, reflecting the resulting triangles through their
sides, and so forth.
I made a couple movies of this, illustrating this procedure as you
move through the space of triangles. Observe how, for only four shapes
of triangles, the resulting set of triangle vertices is discrete.
I’m grading for the first year topology course at Chicago, and one of their homework problems asked them to show that pairs of (indistinguishable!) points on a circle correspond to points on the Möbius strip; in other words, the quotient of the torus $T^2 = S^1 \times S^1$ by the $\Z/2$-action which exchanges the two $S^1$ factors is a Möbius strip.
In the above animation, you can see the identification in action: the two red points on the green circle correspond to the red dot on the Möbius strip.
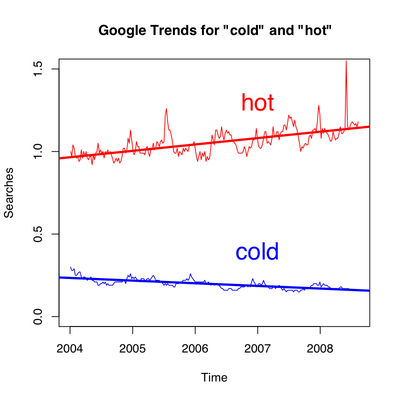
Google Trends plots the search volume (or some other measure? search percentage?) for a given phrase over time. It’s ridiculously fun!
As an example, let’s look at the number of times people search for the words hot and cold. I downloaded the CSV file offered by Google trends to make the following graph:
The thick red and blue lines are the linear regressions on the number of searches for hot and cold, respectively. Behold!—people are searching more often for hot lately, and less often as of late for cold! The search volume does seem to be related to the temperature: you might notice that the search volume for cold dips under the regression line during the summer, but exceeds it during the winter.
And so, global warming is being revealed in our search habits. Maybe I should’ve titled this post “Google warming.”
The Romans (among others!) wrote in wax with a stylus; the wax was embedded in boards, which were bound together in pairs. If a Roman were to place clay between these boards, could they make a copy of their wax tablet in the clay?
It strikes me as remarkable that coins were minted so long before books were printed—though I guess the motivation behind minting coins and printing books are rather different.
I’ll briefly introduce the Lights Out puzzle: the game is played on an n-by-n grid of buttons which, when pressed, toggle between a lit and unlit state. The twist is that toggling a light also toggles the state of its neighbors (above, below, right, left—although, on the boundary, lights have fewer neighbors). All the buttons are lit when the game begins, and the goal is to turn all the lights off.
There are two key observations:
toggling a light twice amounts to doing nothing,
toggling light $A$ and then light $B$ has the same effect as toggling $B$ and then toggling $A$.
As a result, the order in which we press the buttons is irrelevant. So to solve the n-by-n puzzle, we just need to know whether a button needs to be pressed. My old website had some pictures I made showing solutions for boards of various sizes—pictures where a white pixel meant “press” and a black pixel meant “don’t press.” I assembled these pictures into a video, showing solutions to the Lights Out puzzle for $n \leq 200$:
For as cool as that looks, there’s not much to be discovered (as far as I can tell) from watching these frames flash by. But it does look like about half the buttons have to be pressed to solve the puzzle: why is that?
Finding that solution involved row-reducing a $(400 \cdot 400 + 1)$-by-$400 \cdot 400$ matrix—that’s a matrix with over 25 billion entries. On the other hand, each entry is one bit, so that matrix fits (not coincidentally) in 3 gigabytes of memory. One could surely do better, considering how sparse the matrix is: perhaps we could have a little contest for solving very large Lights Out games.
Besides the fact that all these pictures look awesome, Lights Out is a neat example to motivate some linear algebra over a finite field. It illustrates how satisfying an “easy” local condition (each light must be turned off) might require a globally complicated solution—a lesson for mathematics and for life!
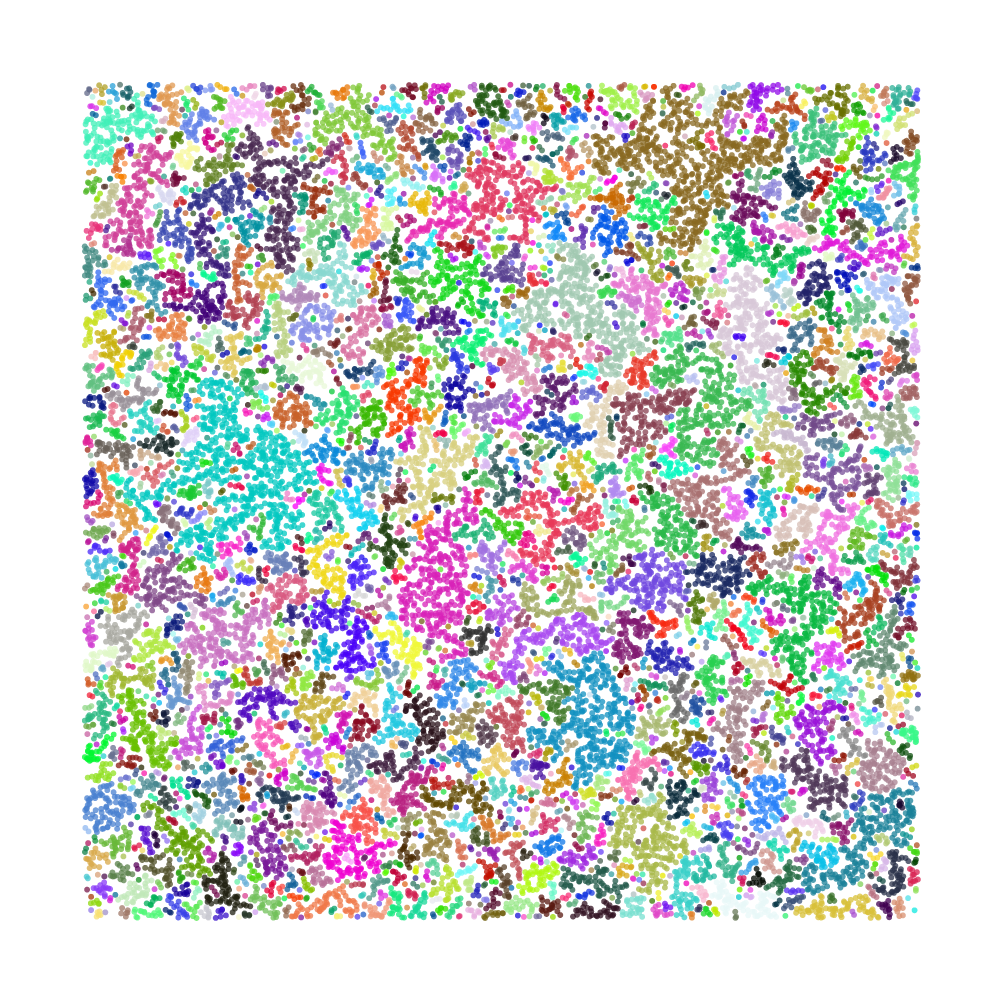
I made a movie recently for my advisor. The movie is so pretty, that I thought I’d share it here: may I present to you randomly drawn dots, where two dots are the same color when they touch!
I’ll be a bit more explicit: a dot is drawn at a random location; if it does not overlap any previous dots, it gets a new color. Otherwise, the dot takes the color of the component it touches. Sometimes a new dot connects many components, and in this case, the new component takes on the color of the largest among the old components.
There’s a lot of neat questions to be asked about such a process: for instance, after drawing n dots, how many components should we expect to see? As you can see in the movie, when you draw only a few dots, most of those dots are isolated and have their own color; but after drawing a ridiculously large number of dots, they are all connected and the same color. And inbetween, something more interesting happens.
Here’s an example of “something more interesting” taken from a larger picture than the above movie:
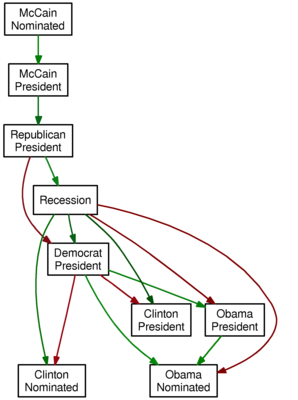
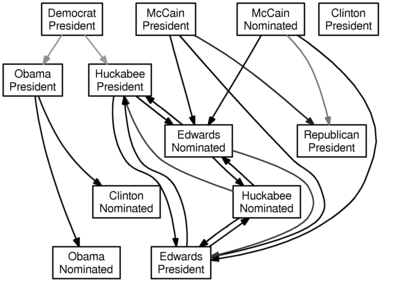
I’m again applying Granger causality to time series data from Intrade. This time, however, I connect box A to box B with a
green arrow if A becoming more likely causes B to become more likely, and with a
red arrow if A becoming more likely causes B to become less likely.
Shorter arrows suggest stronger relationships (technically, a lower p-value).
Running the algorithm on the market data since January 1, 2008 with a lag of two days produces the following graph:
And so, we see that the market data is encoding some
tautologies (McCain’s nomination makes him more likely to be president, and McCain’s being president makes it more likely that a Republican is president) but also some
conventional wisdom (a recession makes Clinton more likely to be nominated, but Obama less likely to be nominated; perhaps the perception that Obama would fare better in the general election explains the red arrows from “Democrat President” to Clinton, and the green arrows from “Democrat President” to Obama).
It’s amazing to me (and hopefully also to you) that the relationships between the prices of these Intrade contracts manages to encode popular sentiments.
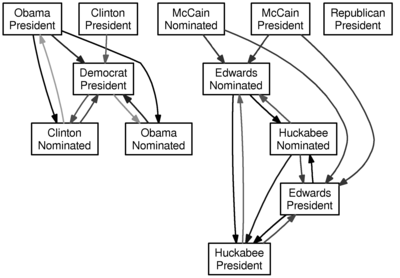
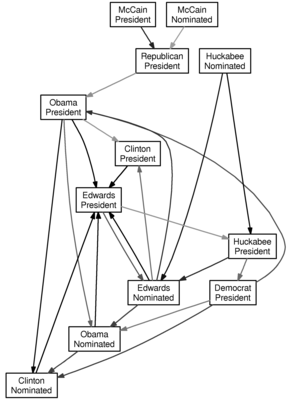
Granger causality is a technique for determining whether one time series can be used to forecast another; since the Intrade market provides time series data for political questions, we can look at whether political outcomes can be used to forecast other political outcomes.
There’s a library for the statistical package R to do the Granger test, and Intrade produces CSV market data. I fed the market data for various contracts since January 1, 2008 into R, and the output of that into GraphViz to make a nice-looking visualization; in particular, I connect $a$ to $b$ if $a$ Granger-causes $b$ with $p$-value less than 0.05. Darker arrows have smaller $p$-values. This is all an embarassing misuse of statistics and $p$-values, but it is quick and easy to do, and the results are fun to see.
Here is the graph for a lag of one day (i.e., does yesterday’s value of $a$ predict today’s value of $b$):
Here is the graph for a lag of two days (i.e., can the two previous days of data for $a$ be used to forecast the next day of data for $b$):
And here is the graph for a lag of three days:
Don’t take this too seriously. And one word of warning: an arrow from $a$ to $b$ does not mean that if $a$ is more likely, then $b$ is more likely—rather, it ought to mean that past knowledge of $a$ can be used to forecast $b$. I suppose it would be interesting to add some color for the direction of the relationship, and maybe I’ll do that when I have another free hour.
I made some movies of some of my favorite complexes: let $I^n$ be the $n$-dimensional cube, and let $e_1, \ldots, e_n$ be the $n$ edges around the origin, and let $e_i e_j$ be the square face containing the edges $e_i$ and $e_j$. Define a subcomplex $\Sigma^2_n \subset I^n$ consisting of the squares $$e_1 e_2, e_2 e_3, \ldots, e_{n-1} e_n, e_n e_1$$ and all the squares in $I^n$ parallel to these. It turns out that $\Sigma^2_n$ is a surface with a lot of symmetries.
In particular $\Sigma^2_4$ is a torus in $\R^4$, and here is a movie of it spinning:
I’m particularly fond of this, as you can really see that four squares are coming together at each vertex (hence, it has zero curvature), and you can see the hole in the torus as it spins.
The complex $\Sigma^2_5$ is a genus five surface in $\R^5$, and here is a movie of it spinning:
I represented the extra dimensions with color—not that it helps much!
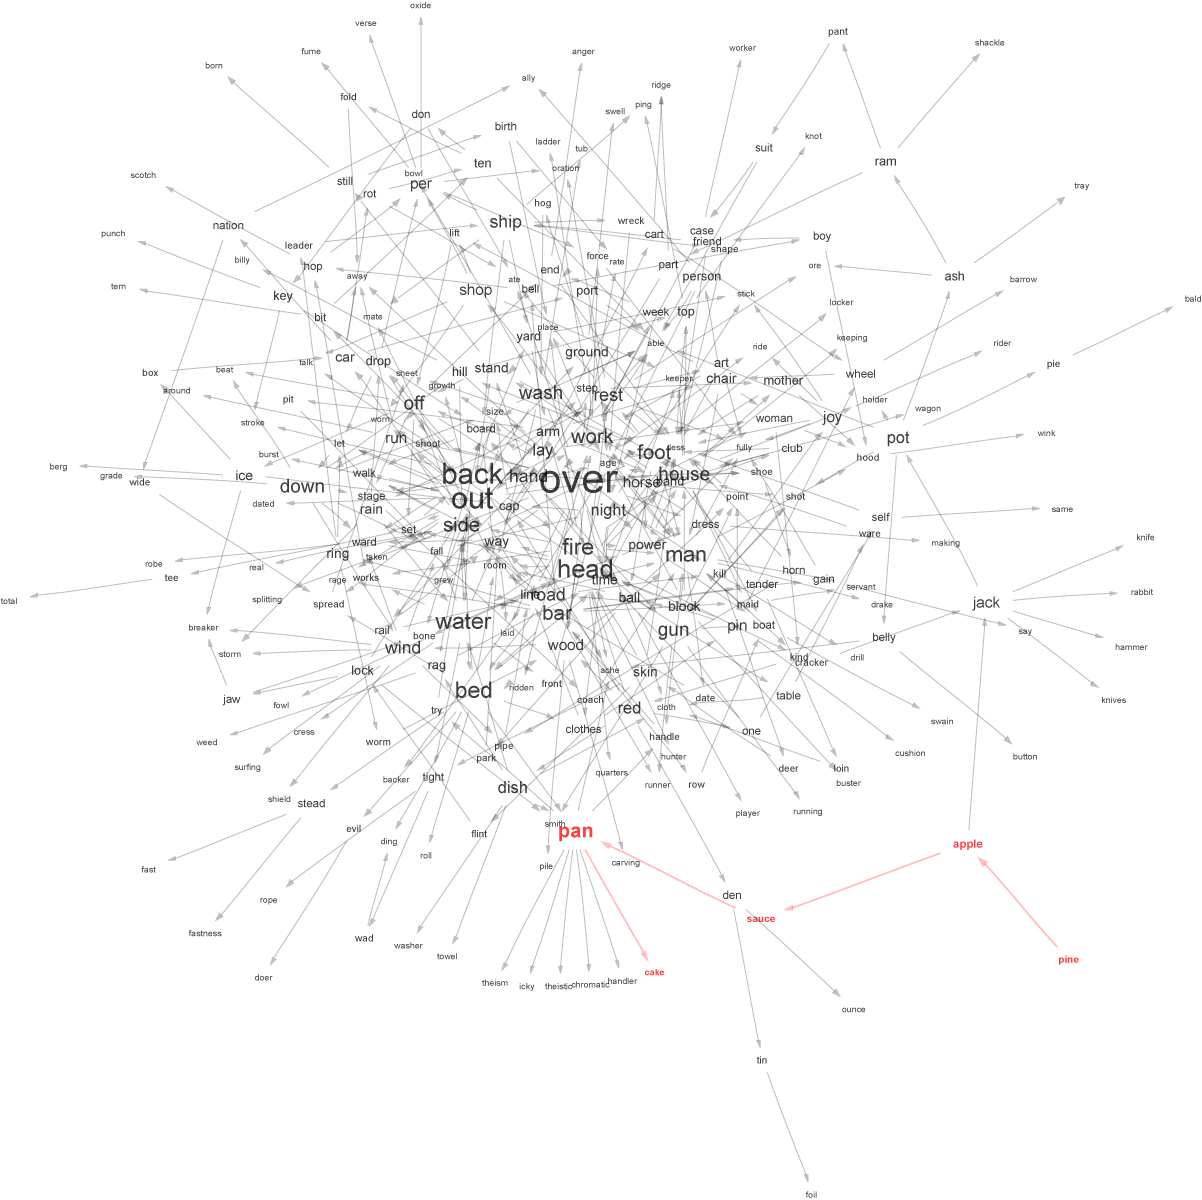
The pineapple sauce pancake graph has English words as vertices, and a directed edge from $a$ to $b$ if the concatenation $ab$ is also an English word. For instance, there is a vertex labeled pine, and a vertex labeled apple, and an edge from pine to apple.
Anyway, the graph is huge; and the usual visualization tool (Graphviz) doesn’t work particularly well on the whole graph, so I took a few hundred vertices around pine, apple, sauce, pan, and cake. The result was the following:
It was pointed out to me by Kenny Easwaran that I ought to try clustering texts that already have a natural grouping.
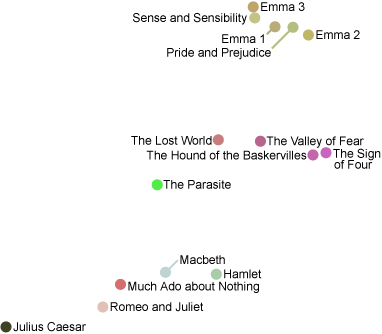
So I ran the clustering program on 15 texts written by three authors, and here is the result:
The largest eigenvalue is 25 times bigger than the next largest eigenvalue, and picks out the author pretty well. The top pile consists of Jane Austen’s books (with Emma split into three volumes). The middle pile consists of Sir Arthur Conan Doyle’s books, with the Sherlock Holmes mysteries (Valley of Fear, Sign of Four, and Hound of the Baskervilles) grouped closer than the others. The bottom pile are five of Shakespeare’s plays.
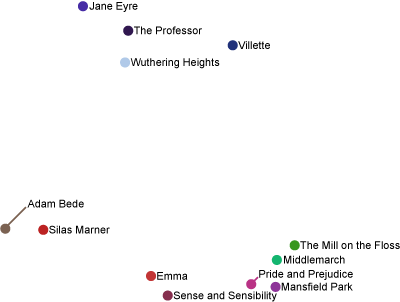
Of course, these people are all pretty different. As requested below by Theo, let’s run it one more time, using 12 books from George Eliot, Jane Austen, and the Brontë sisters.
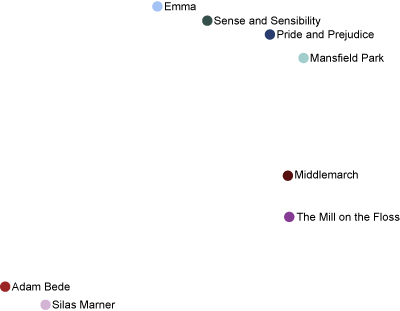
Well, that didn’t quite work. The books by the Brontë sisters (Wuthering Heights, Villette, The Professor, Jane Eyre) have been separated from the others, but George Eliot and Jane Austen are getting mixed together. Admittedly, if you just project to the y coordinate, the authors are sitting in disjoint intervals. Nevertheless, this isn’t as nice as I might hope; so let’s run it again, just on the eight books written by the two authors that aren’t being sufficiently separated:
I suppose this is somewhat better, though it’s basically just a stretched out and inverted version of the previous image. Jane Austen’s books (Sense and Sensibility, Pride and Prejudice, Mansfield Park, Emma) are all up on top, and George Eliot’s books still aren’t piled together.
You might have guessed that I have Project Gutenberg to thank for the text files (including the Shakespeare plays).
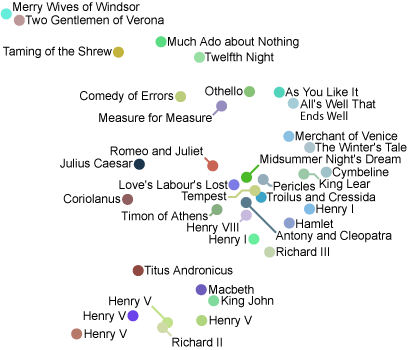
I ran my clustering program (which I just ran on the New Testament) on Shakespeare’s plays—which were conveniently packaged into a text file by Open Source Shakespeare.
The result was the following graph:
I know little about Shakespeare, so I can’t say too much about the above image. I’d love to know what you think: does this arrangement of his plays make any sense?
Given that modern processors are so good at vector and matrix calculations, I’m surprised that this sort of visualization tool doesn’t appear in more places. For instance,
Your blogs and email could be organized this way. Imagine lasso-ing a bunch of similar emails to reply to them all at once!
News could be organized into nice piles.
Your desktop and personal files could be arranged automatically into relevant piles.
Then again, maybe the idea of piles appeals to me more than most people—just look at how I organize the papers and books on my desk!
While we (meaning my wife and I) were filling out the forms for our marriage license, we were interviewed by NPR for Morning Edition! A copy of the broadcast is available online.
National Bingo Night (which seems to me to be very silly, but ignoring that…) has a “play along at home” game, where you print out a bingo card.
How would I design this? I had hoped that the website generated a Bingo card, digitally signed it, and then sent the signed card to the user. If it had been designed that way, ABC wouldn’t even need to remember which cards had been generated, as long as their private key wasn’t compromised.
How many Bingo cards are there? The first two and last two columns of a Bingo card are a sequence of 5 numbers drawn from 15 possible numbers, and the middle column has a “free” square, so it consists of only 4 numbers from 15 possible numbers. Anyway, this is $(15 \cdots 11)^4 \cdot (15 \cdots 12)$, which is a big number. In base 36, it is 18 digits long.
But the base 36 number below the National Bingo Night cards is only 10 digits long. Thus, this 10 digit number can’t encode the whole Bingo card–there are too many cards.
“ABC’s National Bingo Night” (the “Show”) Home Viewer Sweepstakes (June 2007) (the “Sweepstakes”) is a seeded instant win game. Unlike bingo, where selected numbers are drawn live before an audience of players who have purchased or otherwise obtained randomized cards, in this Sweepstakes the relevant numbers are known to Sponsor ahead of time, due to the nature of the recording schedule of the Show. Based upon the numbers drawn during prior in-studio tapings of the Show, Sponsor then randomly distributes a specific, predetermined number of potentially winning Sweepstakes “Game Cards.”
So they already know who will win, because the numbers have already been drawn. The serial number only has to encode “Winner” and “Loser.” Not so interesting.
I wonder, though, if there are other web games that actually use digitally signed objects for fun purposes?
I am frequently amazed to discover that songs which I had believed to have been original are actually covers. It turns out, for instance, that TMBG’s “Istanbul (not Constantinople)” is a cover of a song from the 1950s.
Ironically, one might argue that Istanbul is itself a cover of Constantinople–and that argument (unifying form and content) reminds me of the language games played by Salt: Grain of Life, a book asserting that its very structure resembles the culinary crystal it purports to discuss.
Most mammals produce their own vitamin C, but humans carry a mutated form of the gene responsible for one of four enzymes enzymes necessary for vitamin C production, and so we humans must find it in our diets. In effect, every human being has a metabolic deficiency!
And in light of this wonderful news, why not ingest tremendously huge amounts of vitamin C?
In fact, I’d like to make this into a double-blind study of myself. Here is what I would like to do: randomly take either a placebo pill or a vitamin C pill (without my knowing which I took), and record the type of pill I took. At the end of the day, I would further record how I feel (as a number from 1 to 100, perhaps), and then do a regression to see if the type of pill I am taking is correlated with how I feel.
In fact, I should do this with all sorts of things in my life. Certainly I should be doing this with my caffeine intake, because I feel so convinced that I am much happier while drinking coffee, but that may only be an effect of the coffee–which is, wonderfully and exactly, the point.
The question is: how little can I spend to feed myself for one week? I ought to eat 2000 calories/day, so I’ll need to purchase 14,000 calories/week.
Here’s a “healthy” option: just eat apples. One ounce of apple has 15 calories, so I’ll need to eat 58 pounds of apples per week; I might be able to get this many apples for 29 dollars.
But I can do better! One “Take 5” candy bar is delicious and contains 210 calories, so I’ll need to eat 66 candy bars per week; in the best of all possible worlds, I might be able to purchase this many candy bars for 22 dollars.
I could buy a pound of mayonnaise for two dollars. Apparently a pound of mayonnaise has 3200 calories, so I could get more than enough calories for just ten dollars a week.
Presumably I could do significantly better with potatoes or with rice?
On a recent plane trip, I was reading a very abridged version of (the ten thousand page long!) Church Dogmatics by Karl Barth, and I found something totally beautiful.
Believing God to be entirely “transcendent in contrast to all immanence” and “divine in contrast to everything human,” and reading (e.g., in Philippians 2:7) that Jesus is God having emptied himself, having made himself nothing, I concluded that God somehow hid his divinity in order that he might become human and, in that form, redeem humanity.
This is wrong. Karl Barth writes:
As God was in Christ, far from being against Him, or at disunity with Himself, He has put into effect the freedom of His divine love… He has therefore done and revealed that which corresponds to His divine nature…
His particular, and highly particularised, presence in grace, in which the eternal Word descended to the lowest parts of the earth and tabernacled in the man Jesus, dwelling in this one man in the fulness of His Godhead, is itself the demonstration and exercise of His omnipresence… His omnipotence is that of a divine plenitude of power in the fact that (as opposed to any abstract omnipotence) it can assume the form of weakness and impotence and do so as omnipotence, triumphing in this form…
From this we learn that the forma Dei [Philippians 2:6] consists in the grace in which God Himself assumes and makes His own the forma servi [Philippians 2:7].
–Church Dogmatics, Volume IV, Part 1, page 185 and following.
My cutting hardly does justice to the original text, so I’ll paraphrase.
Jesus shows that God is everywhere, because God is fully in him; this doesn’t undermine omnipresence, instead, it strengthens it: the abstract “God is everywhere” is emphasized by a particular “And look, God is there–it’s Jesus.” Similarly, Jesus shows that God is all-powerful, because God triumphed in him in spite of weakness.
I had been thinking that Jesus was God with a veil over his divinity, when in fact, Jesus is God proving just how totally divine he is. For a God who is Love, the incarnation isn’t a denial of himself, but an affirmation of who he had been all along. It is often said that Jesus proved his divinity by rising from the dead; it ought to be remembered that he proved his divinity by being able to be obedient to death in the first place.
This is a beautiful perspective from which to understand the hypostatic union; the monophysites believed that Jesus’ humanity undermined his divinity, while as Barth explains, Jesus’ two natures are not only compatible, but necessary. This is another example of the sort of paradoxical argument I usually find unreasonably compelling (e.g., Chesterton’s Orthodoxy or Kierkegaard (fear and trembling appears in Philippians 2:12–a coincidence?) or Hume’s compatibilist explanation of free will).
Like most things viewed with hindsight, this perspective isn’t radical, but I (and probably a lot of people) view the divine and human natures of Christ as, essentially, in conflict when, ironically, Jesus came to reconcile those two natures, and did so first in himself.
Given a text in two languages, is it possible to uncover the meaning of individual words?
The Bible is a particularly easy text to work with, since corresponding sentences are marked (i.e., with the same chapter and verse numbers). I downloaded a copy of the Hebrew Bible and the King James’ Version, and looked at Deuteronomy 6:4.
For each word in Hebrew, I found all the other verses with that word, and gathered together all the corresponding English verses; by picking the most popular word from those English verses (ignoring “the” and “and” and such), I found a pretty good translation of the original Hebrew word. In short, I picked the most popular English word in all those verses containing the non-English word.
So here’s Deuteronomy 6:4, with the top six English words underneath each Hebrew word:
אֶחָֽד
יְהוָ֥ה
אֱלֹהֵ֖ינוּ
יְהוָ֥ה
יִשְׂרָאֵ֑ל
שְׁמַ֖ע
one king for side all with
Lord God thy for thou thee
our God Lord for which not
Lord God thy for thou thee
Israel Lord children all his for
not Lord will heard them voice
Remember to read this from left-to-right. Pretty impressive–it didn’t quite get the verb שְׁמַ֖ע but it did well enough anyway.
It also works in Greek. Here’s Galatians 3:26 with the most popular English words underneath each Greek word.
πάντες
γὰρ
υἱοὶ
θεοῦ
ἐστε
διὰ
τῆς
πίστεως
ἐν
χριστῶ
ἰησοῦ.
all that they him for are
for that not him but unto
children shall are them your they
God that for unto not but
are you for that not shall
for that not unto God which
that for unto his which was
faith that for God but Christ
that unto for him not which
Christ Jesus are that which God
Jesus unto that him Christ said
It didn’t quite figure out διὰ is by or through.
In the end, this isn’t shocking, but it’s surprising how easy it is: the Ruby program to do this is only 150 lines long (which includes the code to print out those nice HTML tables with Unicode).
Today, I was about to sit down and read a paper (in French–I may not speak in tongues, but apparently I can read in tongues, so to speak!), and I thought to myself about how nice it would be to have a cookie. I went to Uncle Joe’s, I went to the Classics Cafe, I went to Cobb’s coffee shop, and then I gave up, for there were no cookies in any of those places, places which so often appear to be the source of cookies.
Is there someplace else on campus that I should have looked? Admittedly, I probably would’ve settled for the biscotti in the divinity school cafe (especially with some coffee).
Someone contacted me with some questions about Bayesian document clustering; with that inspiration and a free afternoon a few weeks ago, I took a Hebrew bible and built a matrix $(A_{ij})$ where $A_{ij}$ equals the frequency of the $i$-th (Hebrew!) word in the $j$-th chapter of Genesis. I calculated its singular value decomposition (supposedly this is “latent semantic analysis”), and then took some dot products (calculating the “correlation” of chapters)…
Anyhow, the result was astounding! The following table gives, for each chapter, a list of those chapters for which the given chapter is the chapter most highly correlated with it. Ah, that’s confusing; as an example to clarify this, the chapter most similar to chapters six, seven, eight, and nine is chapter one. With that, here’s the data:
Chapter 1:
2, 6-9
Chapter 5:
11
Chapter 7:
1
Chapter 10:
12-15, 34, 36, 46, 49
Chapter 11:
5
Chapter 15:
16
Chapter 21:
3, 22
Chapter 22:
4, 17-33, 35, 38, 44
Chapter 36:
10
Chapter 37:
43
Chapter 40:
41, 45, 47, 50
Chapter 41:
39
Chapter 45:
37, 42, 48
Chapter 50:
40
The shocking thing is that for 21 chapters of Genesis–for nearly half the book–the most highly correlated chapter is chapter 22–the binding of Isaac. In my mind, that story is the most powerful in Genesis, central to the message, and so it is especially remarkable that this crazy game with matrices also “detected” that most of Genesis clusters around that story.
While on public transportation, my mind wanders… And one might assume the following about me and my buses,
The bus travels for one unit of time,
I will get on the bus at a random time (uniformly distributed),
I will leave the bus at a random time (independent, unformly distributed).
Then the probability that I am on the bus at time $t$ is $p(t) = 2 \cdot t \cdot (1-t)$. So one might expect that the total number of people on the bus at time $t$ to look like $C \cdot t \cdot (1-t)$ for some $C$.
I would enjoy riding a bus from the start to the end, and seeing how accurate this is, though tragically, I rather doubt it is very accurate at all. For starters, the entrance and exit times are correlated (who gets off the bus one stop after they get on?), and there are places where people are more likely to enter, and where people are more likely to exit. In fact, upon further reflection, this is a horrible model of bus ridership.
But, if you, say, averaged all the bus routes to make the entrance and exit distributions more uniform…–is there anywhere I can get this data? Wait, wait, this seems like an awful idea: I’d better stop now.
Thanks to Bryce Johnson for pointing out a mistake in my calculation of the probability $p(t)$ above–I had forgotten to include a factor of two!
When I walk down the street, I create patterns in how I walk, often by controlling my stride length so I will step on cracks every third sidewalk square, or whatnot. If I were a true master, my stride length would be incommensurable with respect to the sidewalk length–surely this was the problem that forced irrationalities upon the Greeks…
Anyway, I was also happy to realize (at a recent retreat) that clothing is nicely categorized by how many disks must be removed from a sphere to produce the particular clothing item. For some examples, consider:
A sock or a hat is a sphere minus a disk.
A headband (or tube top) is a sphere minus two disks.
Jeans are a sphere minus three disks (the fabled “pair of pants”).
A shirt is a sphere minus four disks (the “lantern”).
A bathing suit is a sphere minus five disks.
A fingerless glove might be a sphere minus six disks.
Two fingerless gloves connected by a band is a sphere minus 11 disks.
Another lovely example is that of some scarves, which are a projective plane minus a disk (i.e., a Mobius strip), and therefore sit flat against one’s neck. I would be very interested in owning more non-orientable clothing (someone, somewhere, must own a non-orientable tank top–though perhaps that mythical object would be too annoying to be allowed to exist).
I’ve been (not surprisingly) drinking quite a bit of coffee lately, and I’ve noticed that many corregated coffee cup holders include a bit of loose glue. At first, I thought this was a mistake, an oversight in the perfection of the coffee cup holder design.
On the contrary, that bit of excess glue melts when the hot coffee is poured into the cup, adhering the corregated holder to the cup–brilliant!
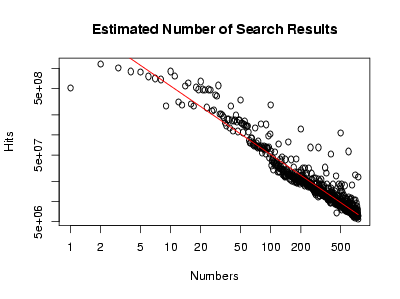
Let $f(n)$ be the number of Google hits for the integer $n$. Then $f(578)$ is about 100 million, and $f(1156)$, that is, the number of hits for a number twice as big, is about 40 million, a bit less than half as big. Doubling the input continues to halve the output: $f(2312)$ is about 20 million (half again!), and $f(4624)$ is about 8 million, and $f(9248)$ is about 4 million.
There are about half as many pages talking about numbers that are twice as big. This is an example of a power law, and indeed, a log-log plot of $f$ looks linear to my blurry vision:
Doing a linear regression in R gives the red line, or in symbols, $$f(x) \approx 5,800,000,000 / x^{1.029}.$$
Rather humorously, this means that $f(a)/f(b) \approx b/a$. In the end, this is not so surprising: Zipf’s law says that, in a corpus of naturally occuring text, the frequency of a word is inversely proportional to its rank; here, we have a similar phenomenon at work: roughly, the popularity of a number is inversely proportional to its size.
In other words, while the number of integers expressible with fewer than $n$ bits grows exponentially in $n$, the number of pages discussing integers expressible with fewer than $n$ bits grows linearly in $n$; being silly, I’d say that this is an asymptotic version of the claim that most large numbers are uninteresting. After all, popular numbers have a lot of fan sites.
I searched for each number between 1 and 500 on Google, and recorded the (estimated) number of hits. I’m not aware of anyone having done this before; in any case, I made a chart:
There’s some periodicity in the above data (every 5, every 10, every 100).
Can you explain how quickly the distribution falls off (is it exponentially decaying, for instance)?
The most popular numbers are, in decreasing order of popularity: 2, 3, 10, 4, 5, 11, 6, 7, 8, 20, 15, 30, 14, 18, 1, 24, 21, 19, 25, 22, 28, 29, 50, and so on.
The most popular numbers ending in 0 are, in decreasing order of popularity and having been divided by ten: 1, 2, 3, 5, 10, 4, 8, 9, 7, 20, 6, 50, 15, 12, 30, 25, 11, 40, 13, 18, 16, 14, and so on. Is the distribution of numbers ending in 0 related to the distribution of all numbers?
Are certain families of numbers more popular? Are prime numbers or square numbers particularly popular?
You can download my comma-separated data file if you would like to play with the data yourself. Note, however, that I got this data from Google’s SOAP interface, which, for reasons I don’t understand, doesn’t give the same number of “estimated hits” as the web page interface.
What can be said about the history of static electricity? Did Greek science know about it? Any medieval experiments with static electricity?
It’s sort of interesting that people knew about magnetism and electricity for hundreds of years before finding many good uses for that knowledge (granted, compasses and potentially batteries for electroplating, but these things are trinkets in our modern world so dependent on electricity); in contrast, the span between radiation and harnessing nuclear power was much shorter (although maybe our modern uses of nuclear power will seem like mere trinkets compared to the awesome uses to come). I guess this isn’t surprising—eh, nothing I say is surprising!
And after listening to Sufjan Stevens’ “A Good Man is Hard to Find,” I read the short story with the same title. I find myself liking “Seven Swans” more and more, and the short story by Flannery O’Connor was quite interesting. The short story of the crane wife (which is used to good effect on the Decemberists new album of the same name) is quite beautiful, too.
And last night, while doing some mathematics, I was also listening to an audiobook (well, podcast) rendition of Plato’s Republic; I had forgotten the thing about the ring that turned people invisible! It’s funny enough that this gets picked up in the Lord of the Rings, but just the idea of such a ring is so provocative—where did the idea come from?
And earlier this week, I was reading about king David’s “mighty men” and about the beautiful Abishag. I find it amusing how the names of these people (e.g., Glaucon in The Republic or Abishag) get remembered, with fame far beyond their expectation, I’m sure.
I tried making bread, but with significantly less flour than neccessary (and therefore, far more water than needed). The result was very much like cooked paste. It was pointed out to me that since the essence of bread is flour, trying to get by with less flour was undermining the very essence of bread (and I find such arguments very satisfying).
I also made baklava again, and that turned out much better than the first time (which involved the baklava burning).
Sometimes I’m scared that, at some point in my past, I opened a pair of parentheses without closing them. Even worse, I’m sure I’ve feared this very thing in the past.
Then again, maybe this is the common fear of all schemers: that our whole lives might now be a parenthetical comment.
Perhaps a half-dozen times in the past week, I’ve read sentences with contain the phrase “must needs.” I have never considered this construction before; frankly, it sounds totally bizarre to my inner ear (my spiritual inner ear, that is).
Thus, it must needs be that I’ve been teleported to another world, a world in which the English language developed differently than it did in the world from which I came. This tiny grammatical gem is the only evidence of my true origin.
I’m still trying to find (two!) new roommates (since my current roommate bought a place, and is moving out on December 15th). If you know anybody who would like to move in with me, I’d love to know about it.
I wonder if anyone knows about alphabet songs in other languages? I’d be particularly interested in knowing about Greek and Hebrew alphabet songs, and a bit about the history of such things. It seems like these songs must be used primarily to teach the lexicographic ordering of the letters; I suppose the Latin alphabet is ordered in keeping with the Greek alphabet, and so forth, but why did the early alphabets get placed in the order that they did? Saying “numeric value”just begs the question (after all, then why those values?).
It also seems a bit odd that Twinkle Twinkle Little Star is song for the alphabet. It also seems like the alphabet song should be related to the zed/zee distinction.
And not too surprisingly, Wikipedia has an article about the Alphabet Songsong). Wikipedia knows too much (although they are still missing an article about superrigidity!).
I’m fond of the Pineapple Sauce Pancake graph: the vertices are English words, and there is an edge from $a$ to $b$ if $ab$ is also an English word (e.g., “pan” and “cake” are English words, and there is an edge from “pan” to “cake” because “pancake” is also an English word).
To play around with this, I wrote a Javascript program, complete with a Web 2.0 logo–which reminds me, I wonder if there is an interpreter for the programming language logo, written in Javascript?
Anyway, what I really wanted to do was to make a wall-sized picture of the Pineapple Graph, but Graphviz isn’t quite able to handle it, but maybe with some tweaking, I’d be able to produce a beautiful poster.
I’ve spent a lot of time constructing languages (Kisonef and Naedari being my favorites); in a similar vein, I also tried to create a language that an alien civilization would be able to understand. I had hoped to put a message written in my universal language in a conspicuous place (say, on a college campus), just to test if what I made really was understandable, even to humans!
But I never got around to that, and plenty of other people have done exactly that. This is related to the following question: state and prove a theorem in such a way that an alien would be able to follow your proof.
But whoa! I found out that Freudenthal (the mathematician) did the same thing: he created LINCOS. Bizarre. I also enjoyed looking at this image that we sent into space and trying to imagine what the aliens must think of people who write with such strange characters.
Last night, there was a terrible thunderstorm in Chicago; I’ve never seen so many trees on the road! I was supposed to land at Midway at 7:30pm last night, but we were diverted to Indianapolis, so I didn’t land in Chicago until 2:00am, and then I waited until 3:00am to get a taxi, so I didn’t get home until almost 4:00am. Crazy!
My house lost power last night, and today some places are still without power. In particular, Co-Op Market’s 53th street store was closed, merely displaying a sign “Closed No Power Mgmt.” Considering that their 47th street store shut down, and that their 55th still (?) lacks price scanners, I can only expect that this power outage is the final blow to Co-Op.
In contrast, the also-powerless-but-superior Hyde Park Produce Market was using a generator to power their cash registers (and to provide one very bright light in an otherwise dark store).
My cell phone still works, even after being dropped into water.
There is a program called PawSense for Windows which detects “cat-like” typing, and then prevents further keyboard entry.
I found some code for filtering keyboard events on Mac OS X, and I wanted to implement something similar. But this raises an interesting question: just what characterizes “cat-like” typing?
The PawSense website suggested that cat paws are very broad, and usually strike nearby keys simultaneously. Another idea is to detect “human-like” typing and then freeze the keyboard whenever non-human typing is detected (which has the useful feature of detecting a future version of cat with smaller paws).
This morning I went to the car to see if I could start it, and at least move it back and forth a bit (as I still don’t have my license). Fortunately, the car started! Unfortunately, the clutch doesn’t seem to do anything.
I am holding down the clutch while the car starts, but then I can’t shift into reverse: all I hear is gear-grinding. I can’t shift into first at all; the knob won’t even move there. With the car off, I shifted into reverse, and then started the car (okay okay, I realize now this was a truly stupid idea), but it merely lurched backward before the engine died. It’s just as if I let up on the clutch too quickly without enough gas…
I guess the clutch isn’t doing anythnig at all.
This must be a consequence of my having not driven it while I was away; the emergency brake is sort of loose feeling, the door locks are sticking, and, rather tellingly, the clutch sort of squeaks when I move it. I guess this means I will have it towed away again to be repaired again; at least the people at the transmission shop are very nice.
I really just want to learn how to drive. Someday, someday.
The first was, while singing in the bathtub, I hit a resonant frequency, and I wondered: what can be deduced about the shape of my bathtub (well, bathroom) from this frequency?
The second was that I heard something fall into Tasha’s water dish; thinking nothing of it, I was rather shocked (well, not literally shocked, but…) to find that it was my cell phone that had fallen into Tasha’s water. Uh oh.
And now I am trying to dry it off with a hairdryer.
Often, Tasha picks something up (say, a pen, or a lego), carries it around, and then drops it into her water bowl. I have no idea what she is thinking when she does this. On the topic of cat thoughts, the Wikipedia article on cats observes:
Some theories suggest that cats see their owners gone for long times of the day and assume they are out hunting, as they always have plenty of food available.
I desperately hope that Tasha believes that I am out hunting (mathematics?). In any case, seeing her carry the legos around answers an old question of mine: about two months ago, I noticed that lego pieces were “mysteriously” appearing in my shoes. The Wikipedia article goes on to note that:
It is thought that a cat presenting its owner with a dead animal thinks it’s ‘helping out’ by bringing home the kill.
In other news, the welcome dinner for GCF went spectacularly well; afterwards, we played Loaded Questions, and I learned that people associate tildes with me to a much stronger degree than I would have believed.
I left California far too quickly: some people that I had really wanted to see I didn’t get to see. But I got to spend a lot of time with my dad, which was excellent, and the conferences and Berkeley itself were a lot of fun.
I understand why clutching functions are called clutching functions: a automobile’s clutch transmits rotation from one object to another under the control of the driver, and a clutching function likewise glues together two different rotations under the control of the mathematician.
Having been gone for two weeks, the beautiful cat Tasha has decided that my chair is her chair.
I saw a poster that described a play as “crunchingly witty.” This seems like a very strange sort of wittiness to me.
I am still in California, and very much enjoying public transportation. Yesterday, I took AC Transit’s 65 bus (the “Euclid” bus) along an extremely (and therefore ironically) curvy road to get off the mountain of MSRI. (The “mountain of misery” belongs in a fantasy novel.)
There’s a lot of people in California I would still like to see.
Here is a really stupid question: If I have a wire (with a changing current) and I bend it around, and measure the induced current in (a finite number of) neighboring coils, can I determine anything about how I have bent the wire? Being more ridiculous, I will weave together wires to make fabric. How do the electrical properties of the fabric relate to its shape? That is, if I run current along one wire, and measure the induced current in other wires, can I deduce anything about how I have bent the fabric?
It strikes me as amusing to measure the speed of something by, say, attaching a magnet to the wheel and then seeing how quickly the magnet is moving past a coil. I wonder how sensitive this would have to be, say, to work as a bicycle speedometer.
Anyway, this is the stuff that bothers me on the bus. Right now, it is my inability to produce more examples of hyperbolic n-manifolds that is bothering me.
I’ve made it to Los Altos: I’m going to be staying with my dad, but during the next couple weeks visiting Berkeley to go to a conference, and to meet up with my advisor.
I ended up talking Route 22 on VTATransit_Authority#Bus_routes), and then walking a few miles to go here, in the dark, using GPS to guide me. I was amazed that this method worked!
I guess I should warn you that I am about to reveal plot details of Dan Brown’s books.
I read Digital Fortress by Dan Brown, which was an unfortunate use of time. That book, for starters, is isomorphic to the Da Vinci Code; they are both about a female cryptologist, who gets involved with a university professor, who is himself dragged into a global conspiracy. Humorously, at one point, they use a 5-letter password (which just happens to the female cryptologist’s name, just like in the Da Vinci Code). And like every Dan Brown book, this book also happens to begin with someone dying, who, as the holder of a secret, tries to reveal his secret before he dies.
The more unfortunate thing was the portrayal of mathematics and computer science in Digital Fortress. Terrifying, really.
My cat Tasha is beautiful, and I will miss her while I am in Berkeley.
I am extraordinarily excited by the possibility that Sufjan Stevens might, in his epic quest to author a musical tribute for all 50 states, choose Minnesota next. Perhaps I am swayed by the fact that I am listening to Sufjan Stevens’ The Avalanche, and realizing again that I rather love him.
And I spend quite a bit of time brushing my teeth everyday, but I rather rarely discuss toothbrushing technique, or, for instance, how I learned to brush my teeth.
It’s great to read the comments and find out what users wish were different: a lot of people don’t just want to Unclose Window but also Unclose Tab.
For me, I really would have liked to have Unclose Window be underneath the Edit menu, but because the undo hierarchy is linked to the window (i.e., when you switch windows, the possible things you can undo changes) it isn’t possible to undo the very destruction of the window itself.
The whole idea of “undoing” something is very amusing, especially the modern sense; the old sense of “undoing” something by destroying it is quite dissimilar from the idea of restoring to a previous state.

